Michelin detail page

Turning container complexity into shipment clarity.

At Michelin, my work centered on making intercontinental shipment risk easier to see, explain, and act on — combining predictive modeling, dashboard design, and exception reporting into one operational decision flow.

Workstreams

Three connected pieces of the Michelin work.

The work moved from prediction to visibility to governance: first identifying risk, then making that risk usable in dashboards, then helping teams turn the output into clearer exception-management conversations.

01Predictive analytics

Lead-time prediction

Built a machine-learning model in Databricks to predict intercontinental lead times and give operations earlier visibility into late-arrival risk.

Databricks analyticsMachine learningDecision recommendations
02Operational intelligence

At-risk shipment dashboard

Produced interactive Power BI reporting that surfaced shipments exposed to late arrival fees, container tracking details, and ocean-carrier performance patterns.

Power BICarrier analysisContainer visibility
03Executive reporting

Exception governance

Collaborated with Michelin exception-management teams to support automatic expediting of at-risk containers and translate exception activity into leadership-ready reporting.

Executive dashboardingProcess automationStakeholder reporting

How the work came together

From raw shipment movement to actionable operating signals.

  1. Pulled together shipment, carrier, container, and exception-management inputs into a clearer operational view.
  2. Built predictive logic to estimate lead-time risk and identify containers most likely to miss expected windows.
  3. Translated model output into Power BI dashboards that gave teams a faster way to search, filter, and prioritize follow-up.
  4. Packaged the work into analyst and leadership-facing reporting so insights could move from model output to operational action.

Dashboard views

Selected Michelin dashboard screenshots.

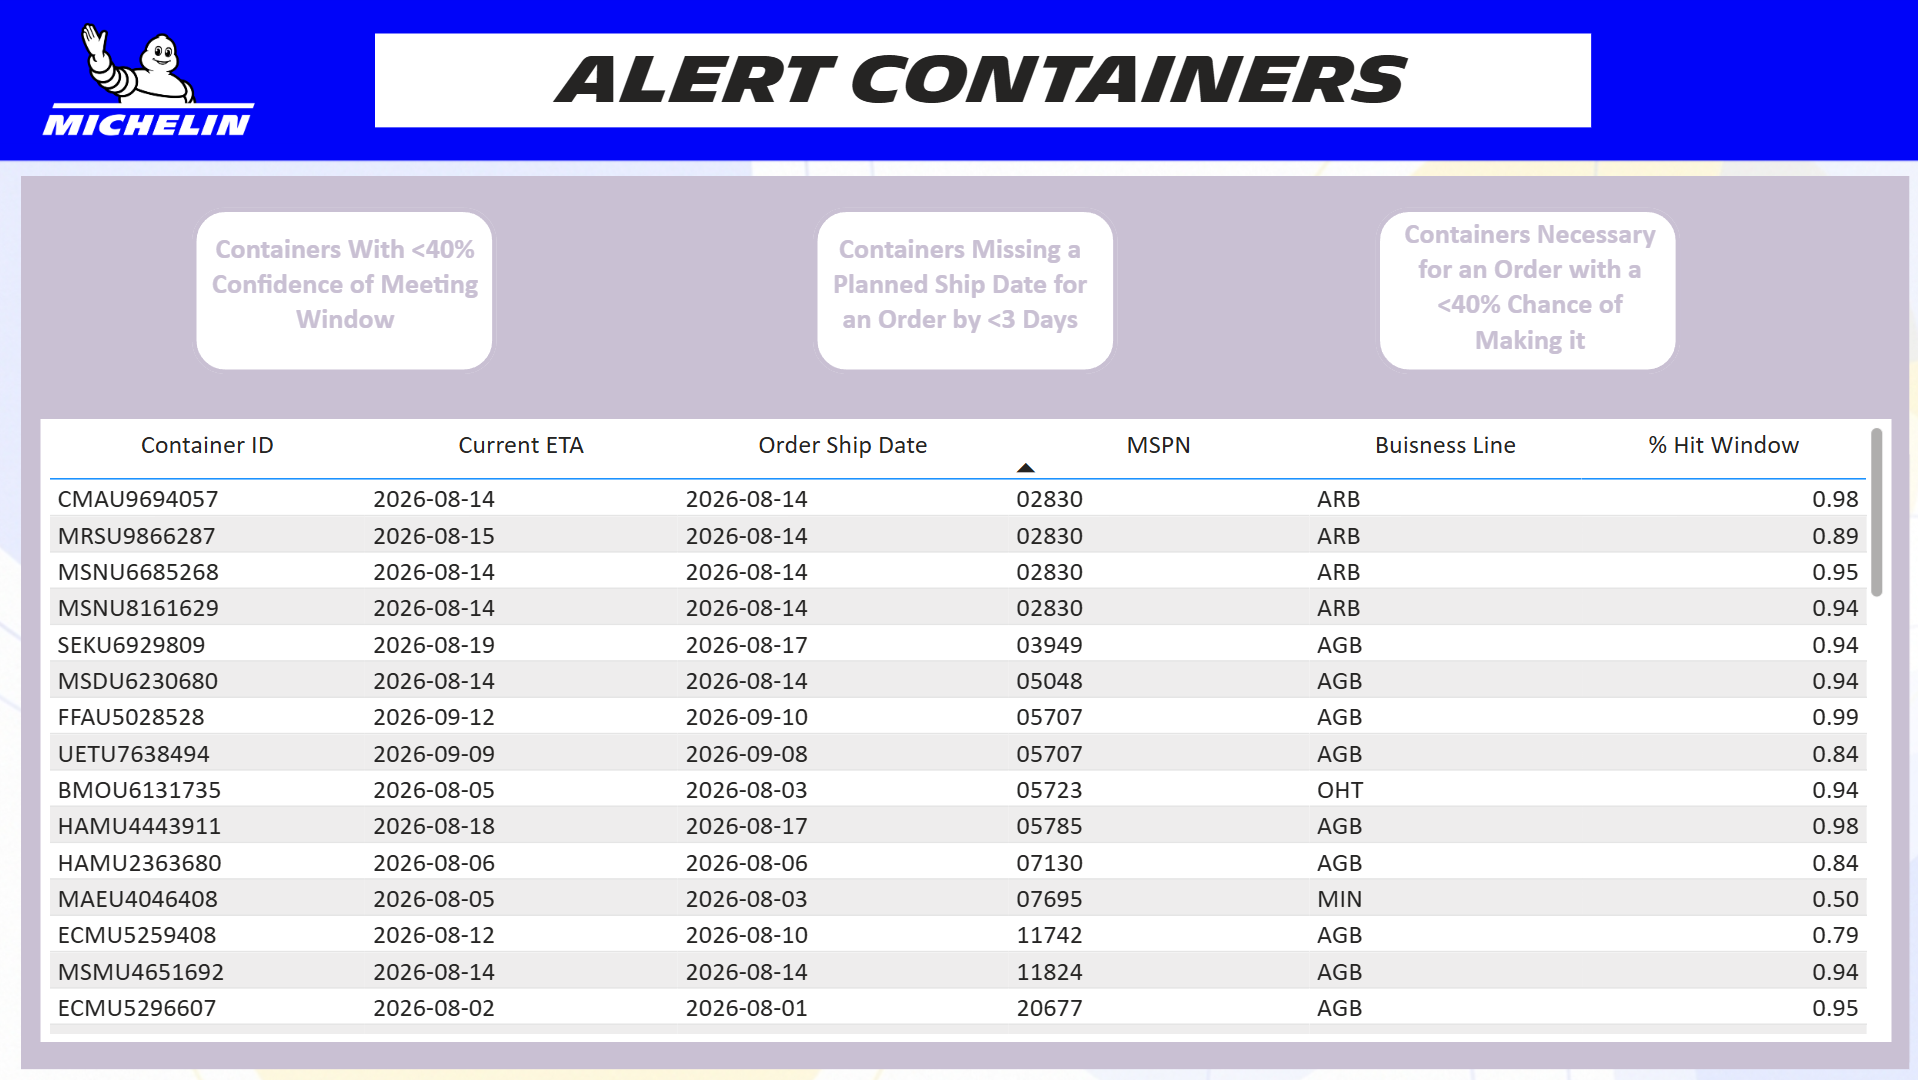
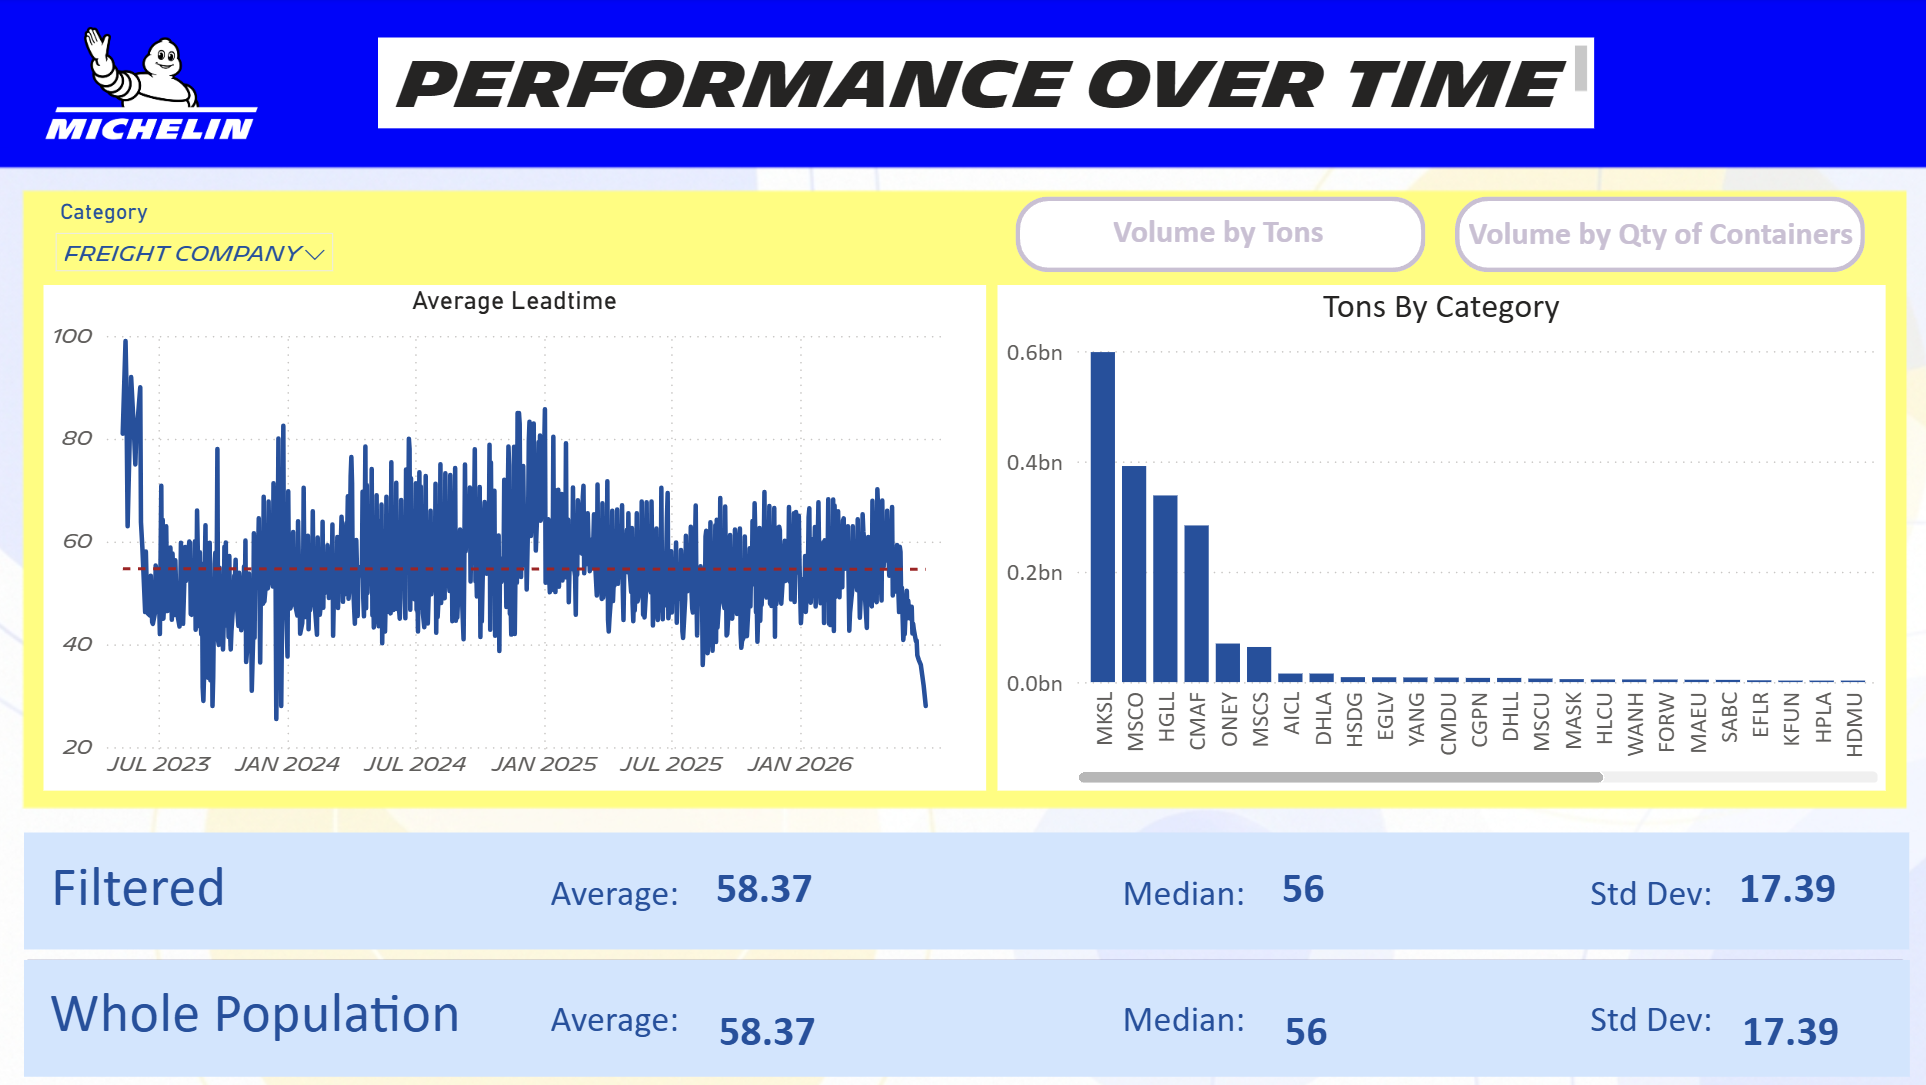
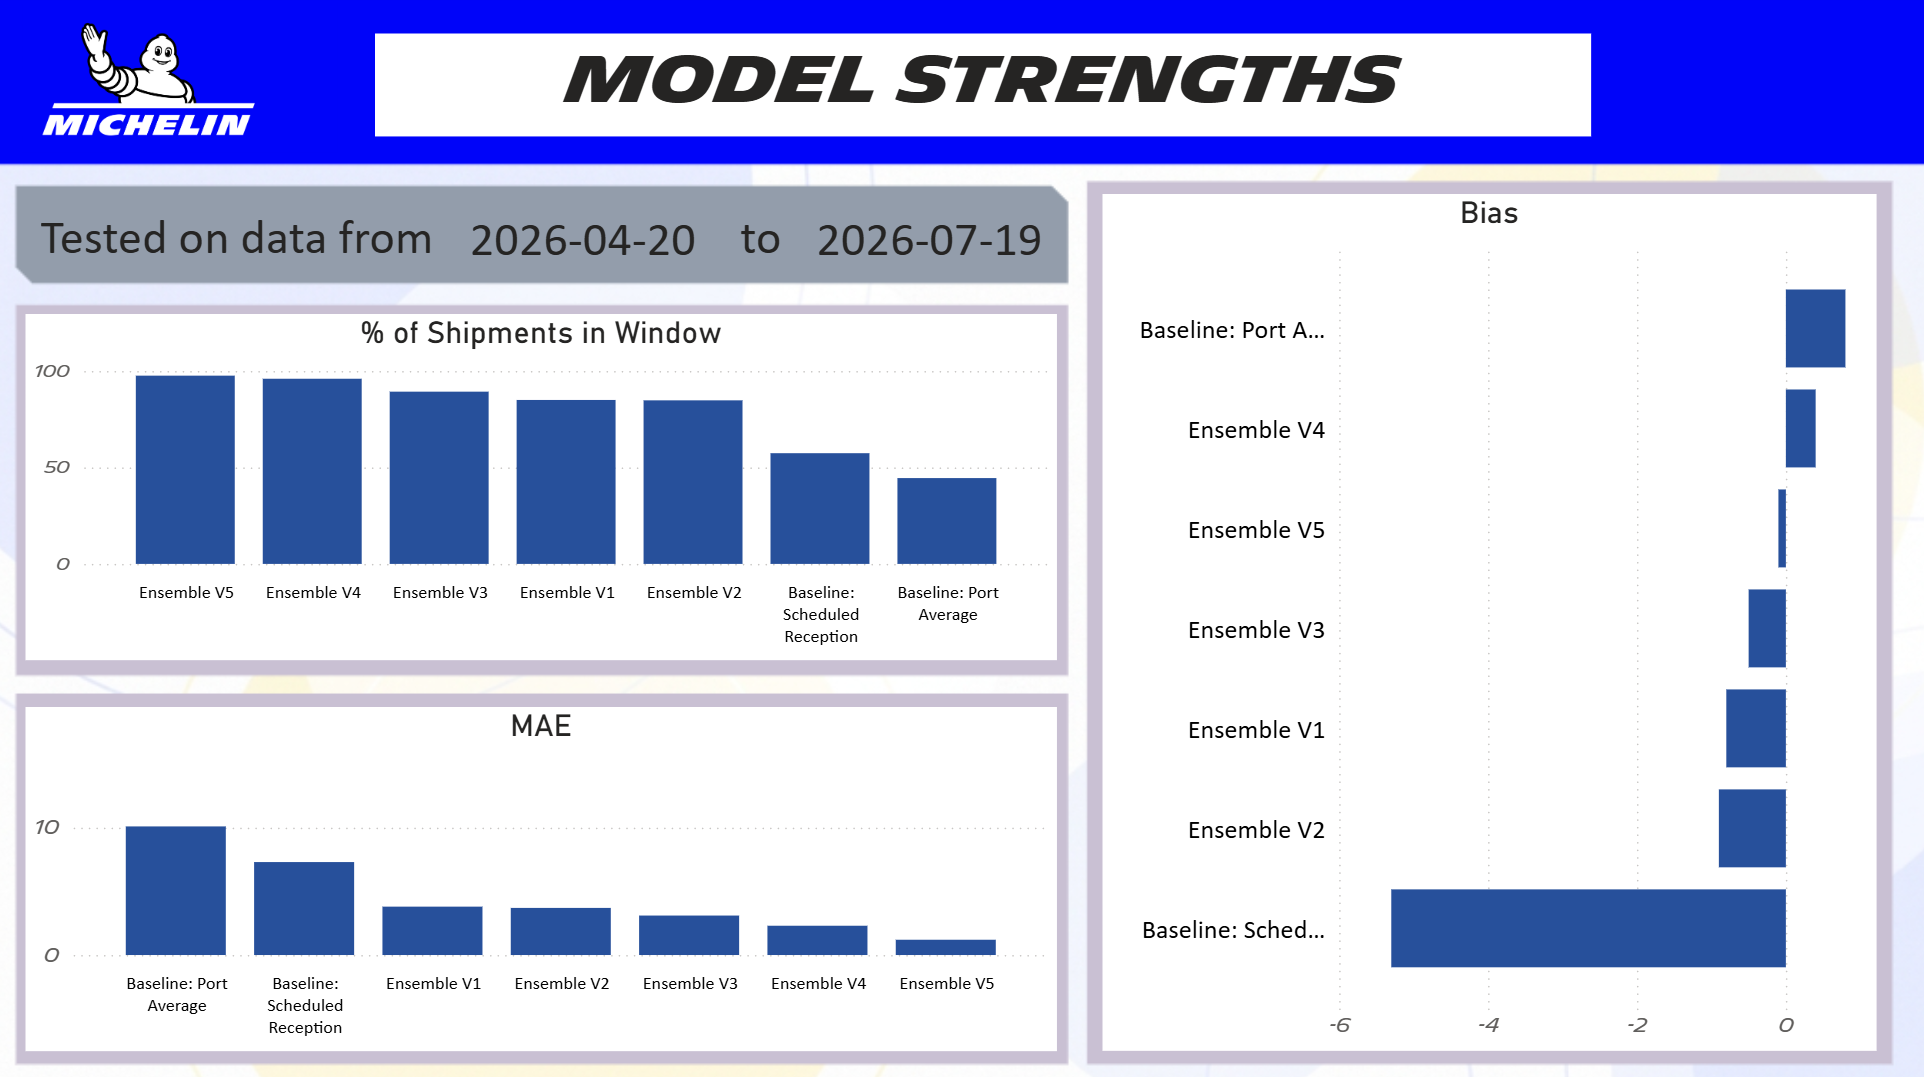
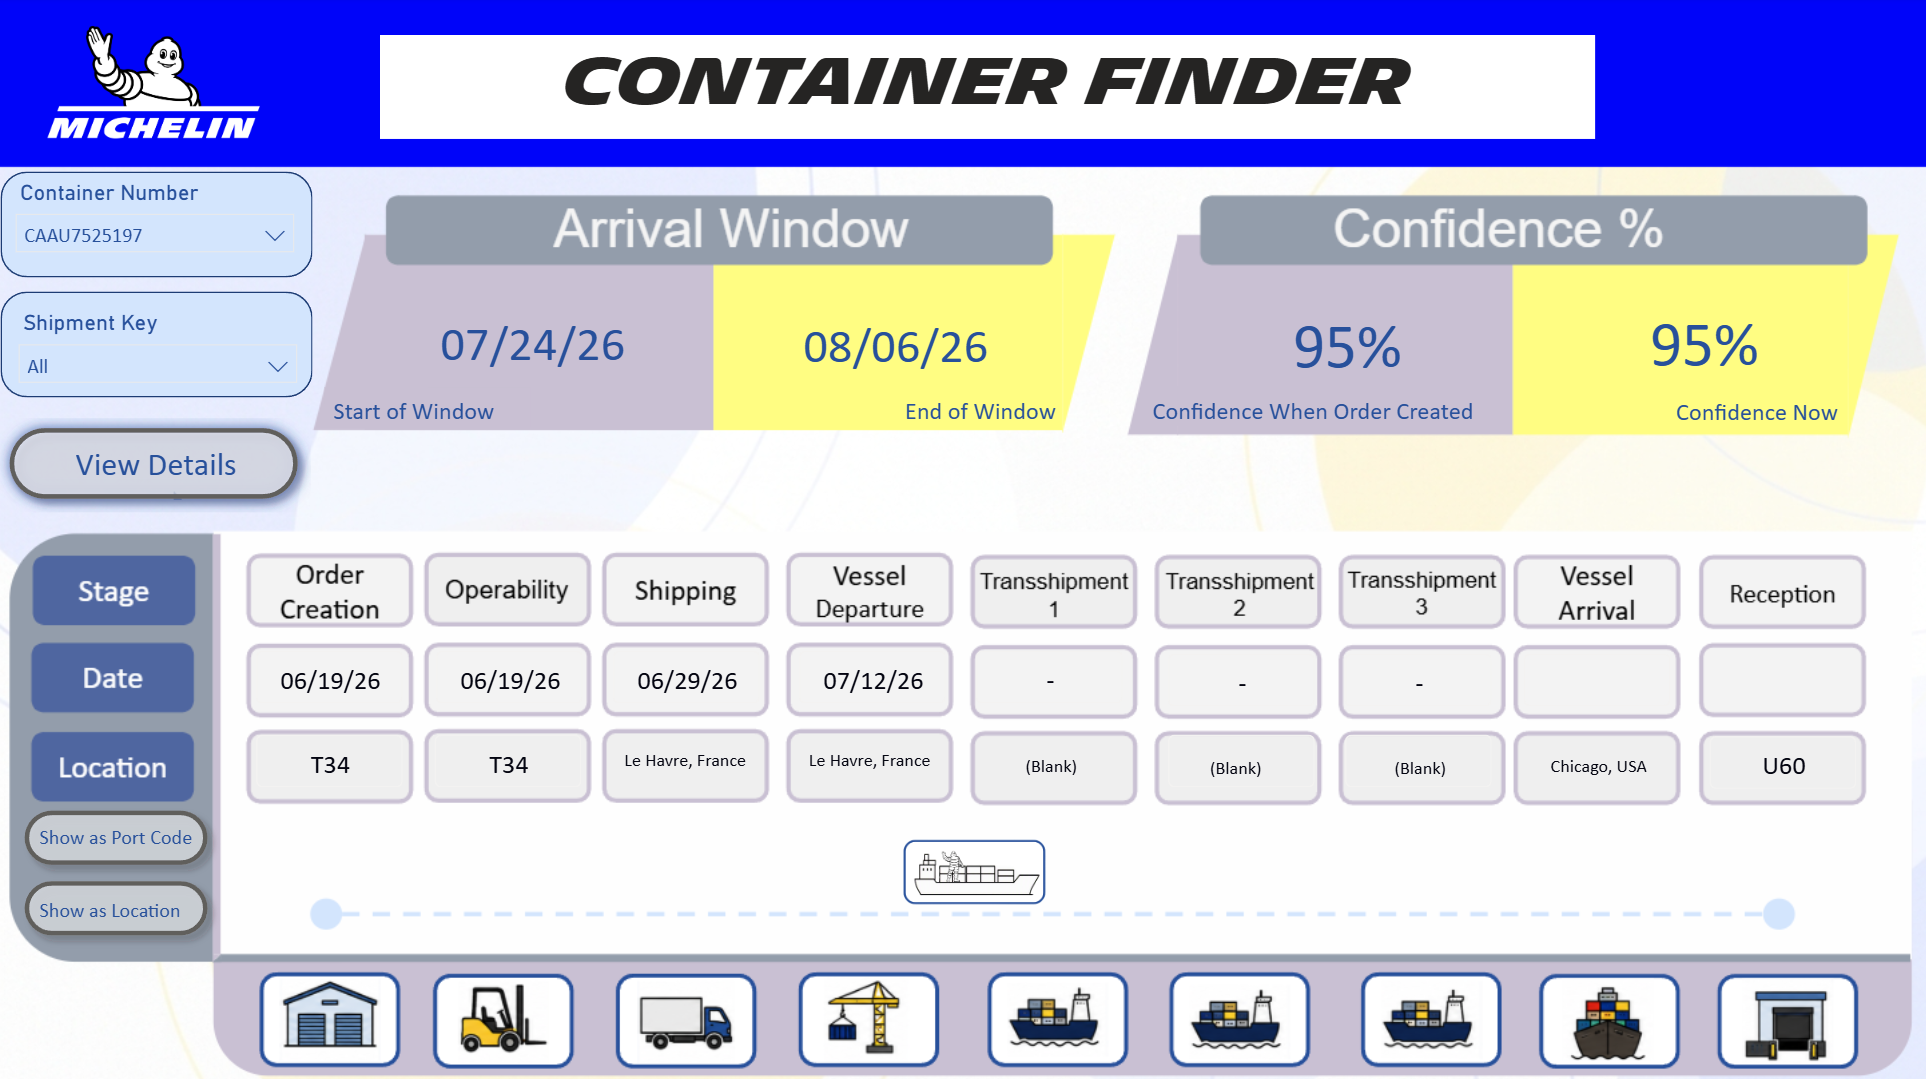
These views show the practical side of the work: searchable container detail, at-risk shipment queues, performance trend monitoring, and model comparison.

Container Finder dashboard screenshot
Container FinderShipment-level lookup for arrival windows, confidence scores, stage timing, and handoff points across the container journey.
Alert Containers dashboard screenshot
Alert ContainersOperational exception view highlighting containers with low confidence, missing planned ship dates, or elevated late-arrival risk.
Performance Over Time dashboard screenshot
Performance Over TimeTrend reporting for average lead time, carrier volume, filtered populations, and baseline comparison across shipment categories.
Model Strengths dashboard screenshot
Model StrengthsModel diagnostics comparing ensemble versions against baseline methods to show where the predictive approach improved reliability.